AirQloud Scoping: A case study of Kawempe AirQloud


Figure 1: PM2.5 Air Quality Index
We define an AirQloud as a designated urban area equipped with infrastructure and allows for engagements. This can be any geopolitical administration level of a country or a country itself.
Kawempe is one of the five administrative divisions of Kampala and the second most populous division in Kampala, located at latitude 0.3792 and longitude 32.5574. This division is a sub-county Administration level and has been selected as one of AirQo’s AirQlouds in Uganda.
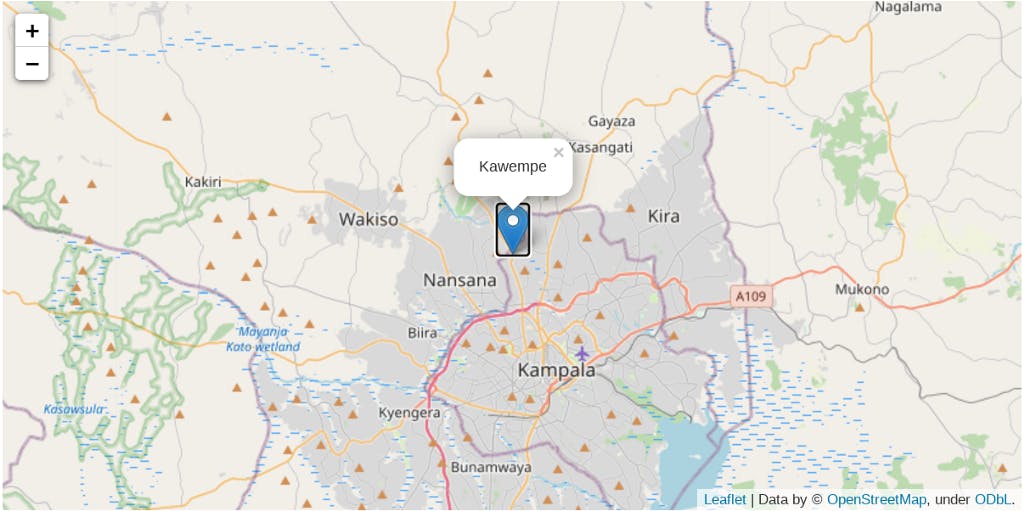
Figure 2: Kawempe
Monitoring Sites
Currently, the AirQloud has air quality monitoring sites totaling ten. These are sensor devices carefully placed at different locations across Kawempe.
These sites are:
- Bahai, Kawempe
- Kyebando, Kawempe
- Kalerwe, Kawempe
- Makerere, Kawempe
- Kawempe Industrial, Kawempe
- Bukoto I, Kawempe
- Kawempe
- Mpererwe, Kawempe
- Lower Nsooba, Kawempe
- Makerere University_01, Kawempe
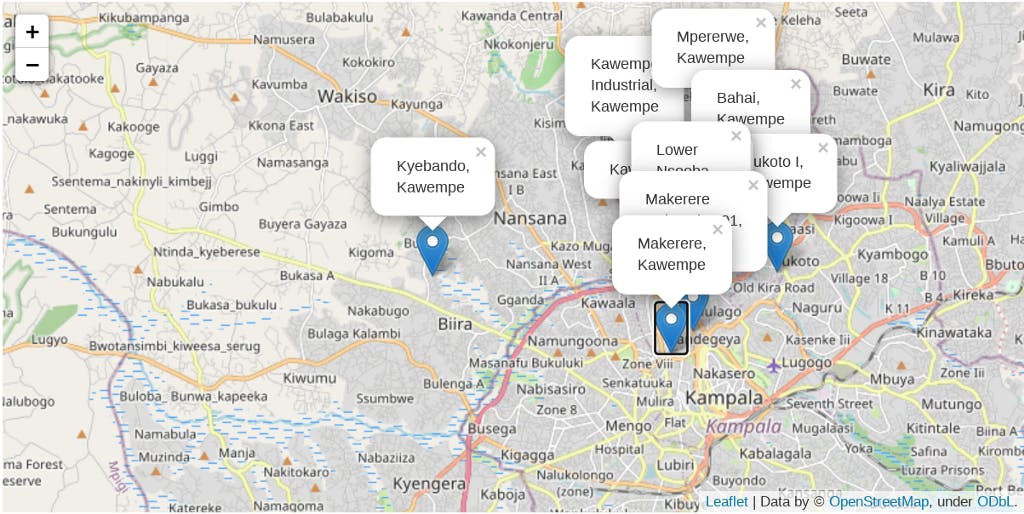
Figure 3: Kawempe AirQloud monitoring sites
Data Visualization
We will be considering visualization functions from three different python visualization libraries — matplotlib, seaborn and plotly.
First, we explore individual site data in the AirQloud to study the trend and peak periods where and when air quality is unsafe. We consider here the data from January to July 2022.
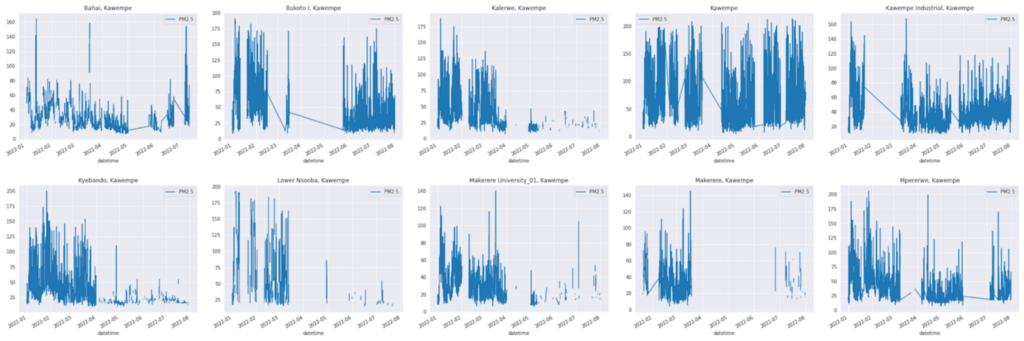
Figure 4: Kawempe AirQloud monitoring sites
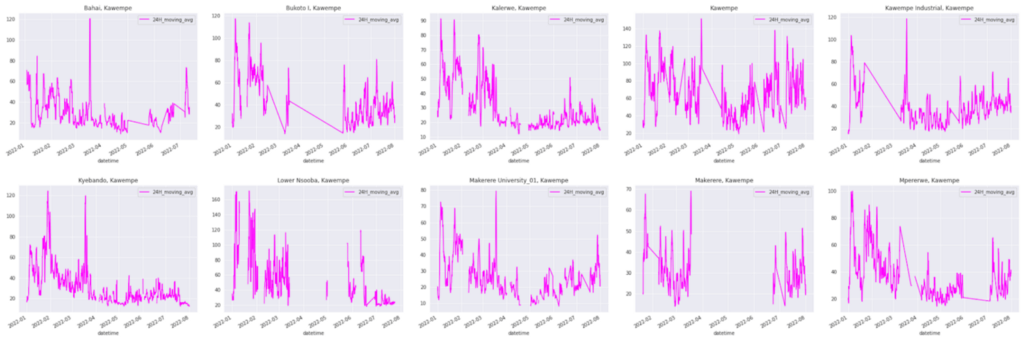
Figure 5: 24 hours moving average
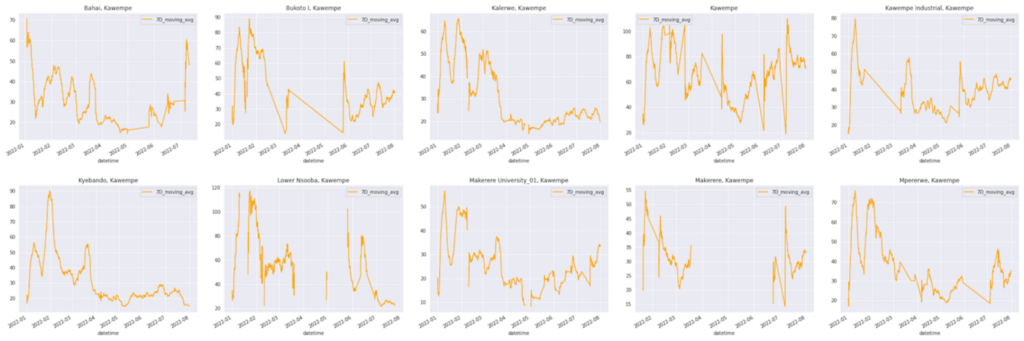
Figure 6: 7 days moving average
Figure 4 depicts the actual data as collected by the device in each monitoring site, while the trend might be hard to determine, Figure 5 shows a clearer trend. Figure 6 further elucidates the pattern present in the data.
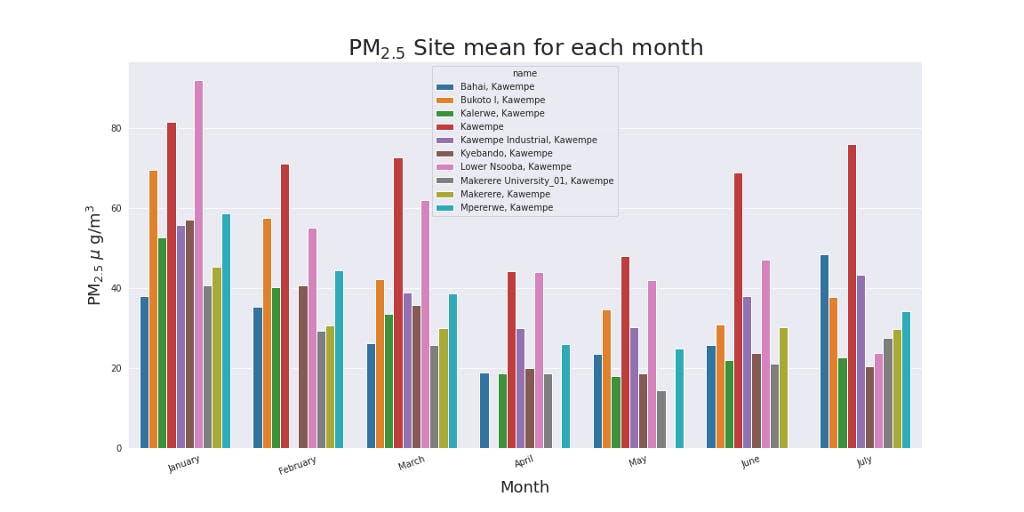
Figure 7: Barchart
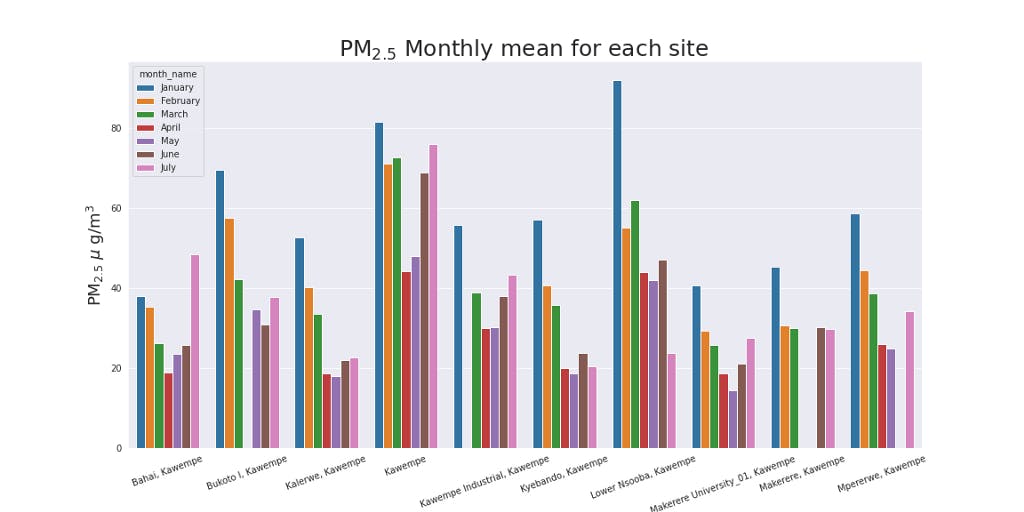
Figure 8: Barchart
Figures 7 and 8 portray the mean PM2.5 hued by monitoring sites and months respectively. January seems to be the month with the worst air quality and the Kawempe site came out the same.
Conclusion
AirQloud scoping is required to maintain data health, which is defined as data management for better discoverability and understanding. It is also part of what informs device maintenance and (additional) monitoring site placement.
Are you a developer? We invite you to leverage our open-source air quality data API on your app or project. Click here to get started.
